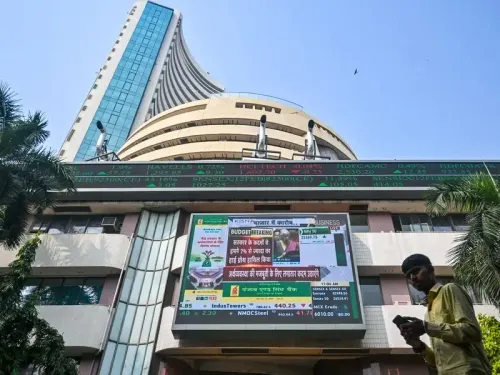
Sensex eyes 79,200, Nifty targets 24,850 next week on FII inflows

Synopsis
Indian equities have staged a meaningful comeback, with the Sensex gaining 2.68% and the Nifty 2.59% in a single week. Analysts now see the Sensex testing 79,200 and the Nifty reaching 24,850 — but only if both indices can decisively clear near-term resistance bands. The rally is underpinned by softer crude, returning FII flows, and a solid start to Q1 FY27 earnings season.
Key Takeaways
Sensex gained 2.68% to close at 78,094.64 ; Nifty 50 rose 2.59% to 24,383.60 for the week ending 2 August .
Both indices posted their second consecutive monthly gain in July .
Analysts see the Sensex targeting 79,000–79,200 on a breakout above the 78,300–78,500 resistance zone.
Nifty eyes 24,850 if it clears the 24,550–24,600 resistance band; the index has reclaimed its 200-day EMA with RSI at 59 .
Key support for the Sensex lies at 77,700–77,500 , with 77,000 as the critical floor.
Rally was driven by softer crude oil prices , easing geopolitical tensions, strong Q1 FY27 earnings , and renewed FII inflows .
The BSE Sensex and Nifty 50 are poised to extend their recovery next week, with market analysts projecting the Sensex to test the 79,000–79,200 zone and the Nifty to eye the 24,850 mark — provided key resistance levels are decisively cleared. The outlook, shared on 2 August, follows a strong weekly rebound driven by softer crude oil prices, easing geopolitical tensions, and renewed foreign institutional investor inflows.
What Drove This Week's Rally
Indian equities snapped a recent losing streak during the week, with a confluence of positive triggers lifting investor sentiment. Softer crude oil prices eased concerns over imported inflation, corporate profitability, and India's external account. Meanwhile, encouraging first-quarter FY27 earnings and a return of foreign institutional investor (FII) inflows provided further tailwinds.
The Nifty 50 surged 2.59 per cent to close at 24,383.60, while the Sensex gained 2.68 per cent to settle at 78,094.64. Both indices also registered their second consecutive monthly gain in July.
Sensex Technical Outlook
Analysts noted that the Sensex reclaimed the 78,000 mark, mirroring the broader market recovery as improving earnings sentiment bolstered confidence. The 78,300–78,500 zone remains the immediate resistance, according to analysts. 'A sustained breakout above this range could propel the index towards the 79,000–79,200 levels,' one analyst stated.
On the downside, the 77,700–77,500 zone is expected to act as immediate support, with the psychologically significant 77,000 level serving as the next crucial floor. A breach below 77,000 could trigger fresh selling pressure, analysts warned.
Nifty Technical Levels to Watch
The Nifty 50 has reclaimed its 200-day exponential moving average (EMA), a technically significant development. The Relative Strength Index (RSI) has strengthened to 59, signalling improving momentum without yet entering overbought territory.
'The immediate resistance for the Nifty is placed in the 24,550–24,600 zone. A sustained move above this hurdle could pave the way for a rally towards the 24,850 mark,' a market analyst stated. A failure to clear this band, however, could see the index consolidate in the near term.
Broader Context and What to Watch
This recovery comes after a period of sustained selling pressure that had weighed on both benchmarks. The dual tailwinds of easing energy costs and FII re-engagement are notable, as both had been headwinds earlier in the year. Notably, the back-to-back monthly gains in July suggest that sentiment has turned, though analysts caution that the rally remains contingent on resistance levels holding as support.
Investors will be watching upcoming macroeconomic data, global crude oil price movements, and any shifts in FII positioning as key determinants of whether the benchmarks can sustain their upward trajectory into the following week.
Point of View
But the rally rests on a fragile tripod: crude staying soft, FIIs not reversing course, and Q1 earnings holding their early promise. All three are externally driven. The Nifty reclaiming its 200-day EMA is technically meaningful, but RSI at 59 leaves room for either direction. If even one of these tailwinds fades — a crude spike on Middle East tensions, a stronger US dollar pulling FII money out, or a Q1 earnings miss from a heavyweight — the 77,000 floor on the Sensex will be tested faster than consensus expects. The market is pricing in a benign scenario; the margin for error is thin.
NationPress
16 Sept 2026
Frequently Asked Questions
What are the Sensex and Nifty targets for next week?
Analysts project the Sensex to test the 79,000–79,200 zone and the Nifty 50 to target 24,850, provided resistance levels are decisively cleared. These targets are contingent on the Sensex breaking above 78,300–78,500 and the Nifty clearing 24,550–24,600.
Why did Indian stock markets rally this week?
The rally was driven by softer crude oil prices, easing geopolitical tensions, encouraging Q1 FY27 corporate earnings, and a return of foreign institutional investor inflows. Together, these factors helped both the Sensex and Nifty snap their recent losing streaks.
What are the key support levels for the Sensex?
The immediate support for the Sensex is in the 77,700–77,500 zone. A breach below the critical psychological level of 77,000 could trigger fresh selling pressure, according to analysts.
What does the Nifty reclaiming its 200-day EMA mean?
The Nifty reclaiming its 200-day exponential moving average (EMA) is a technically positive signal, indicating that the medium-term trend has turned supportive. Combined with an RSI of 59, it suggests improving momentum without the index being in overbought territory.
Did Indian markets post monthly gains in July?
Yes, both the Sensex and Nifty 50 registered their second consecutive monthly gain in July. The weekly gains of 2.68% and 2.59% respectively also helped recover a significant portion of losses from the prior week.