
Has Poverty in India Truly Declined Through Enhanced Living Standards and Incomes?
Synopsis
Discover how India has made remarkable strides in reducing poverty, not just through statistics but through real enhancements in living standards and income levels. This transformation, backed by robust data and innovative methodologies, serves as a model for evidence-based governance and sustainable reforms worldwide.
Key Takeaways
The World Bank's revised figures indicate a significant reduction in poverty in India.
India's poverty rate under the new $3.00 line is 5.25%.
Enhanced data collection methods have improved the accuracy of poverty estimates.
The urban-rural consumption gap has significantly narrowed.
All major states in India reported increased average Monthly Per Capita Expenditure.
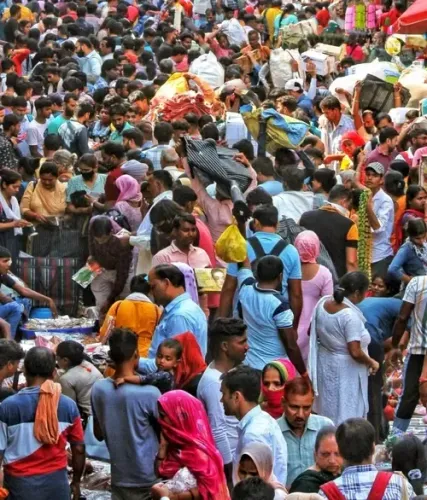
New Delhi, June 7 (NationPress) The World Bank's updated statistics highlight that poverty in India has not only decreased on paper, but has also seen significant improvements in household living standards and incomes, as stated in a government factsheet released on Saturday.
The narrative of India's poverty reduction illustrates a blend of improved methodologies and effective policy outcomes. Facing a heightened poverty threshold, India demonstrated that more accurate data, rather than lowered standards, can unveil true advancements.
As the international community reassesses poverty objectives, India's case sets a benchmark: evidence-based governance, ongoing reforms, and methodological clarity can collectively yield transformative results, as noted in the factsheet.
The World Bank has revealed a significant adjustment to its global poverty measures, elevating the International Poverty Line (IPL) from $2.15 per day (2017 PPP) to $3.00 per day (2021 PPP).
Although this modification resulted in a global uptick in extreme poverty by 125 million, India stood out as a positive anomaly.
Employing more sophisticated data and modern survey techniques, India not only met the new standards but also showcased a substantial decline in poverty.
The revised poverty threshold could have raised the global count of extreme poverty by 226 million individuals. Nevertheless, India’s data revision played a crucial role in keeping the net global increase to just 125 million, as the Indian data alone accounted for a reduction of 125 million.
India’s latest Household Consumption Expenditure Survey (HCES) adopted the Modified Mixed Recall Period (MMRP) method, superseding the outdated Uniform Reference Period (URP).
This transition employed shorter recall periods for commonly bought items, resulting in more accurate consumption estimates.
This led to an increase in recorded consumption in national surveys and a corresponding decline in poverty estimates.
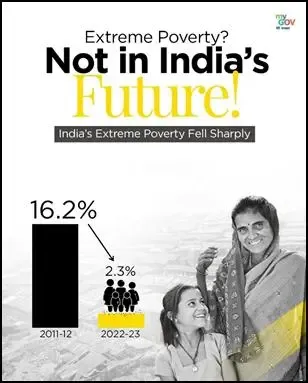
In 2011–12, implementing MMRP lowered India’s poverty rate from 22.9% to 16.22%, even under the older $2.15 poverty line.
By 2022–23, the poverty rate under the new $3.00 line was 5.25%, while under the previous $2.15 line, it dropped even further to 2.35%.
In 2023–24, the average Monthly Per Capita Expenditure (MPCE) was Rs 4,122 in rural areas and Rs 6,996 in urban regions, excluding the value of items obtained through social welfare programs.
Including these, the figures rise to Rs 4,247 and Rs 7,078, respectively. This marks a considerable rise from the rural MPCE of Rs 1,430 and urban MPCE of Rs 2,630 in 2011-12.
The urban-rural consumption disparity has decreased from 84% in 2011–12 to 70% in 2023–24, reflecting reduced consumption inequalities between urban and rural households.
All 18 major states reported a rise in average MPCE for both rural and urban sectors. Odisha recorded the highest rural increase (about 14%), while Punjab experienced the highest urban growth (approximately 13%).
The Gini coefficient, which measures consumption inequality, fell from 0.266 to 0.237 in rural areas and from 0.314 to 0.284 in urban regions between 2022–23 and 2023–24, indicating a decline in consumption inequality across most major states, as per the factsheet.
Point of View
I affirm that India's approach to reducing poverty is a commendable example of how precise data and steadfast reforms can create tangible improvements in living standards. The latest figures highlight a positive trend that not only counters global poverty increases but also demonstrates the effectiveness of evidence-based governance, setting a standard for other nations to follow.
NationPress
12 May 2026
Frequently Asked Questions
What is the current status of poverty in India?
As per the latest estimates, poverty in India stands at 5.25% under the new International Poverty Line of $3.00 per day, significantly down from previous years.
How has India achieved this reduction in poverty?
India's reduction in poverty is attributed to the adoption of more accurate data collection methods, such as the Modified Mixed Recall Period, which improved the accuracy of consumption estimates.
What methodology was used in India's recent poverty estimates?
The latest Household Consumption Expenditure Survey utilized the Modified Mixed Recall Period (MMRP) method, which offered a more realistic picture of consumption patterns.