Did RBI’s all-India House Price Index Experience a 2.2% Increase in Q2 of 2025-26?
Synopsis
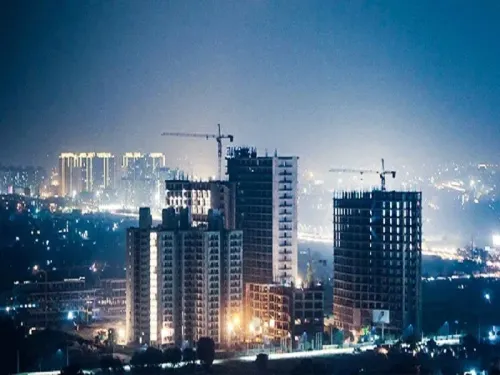
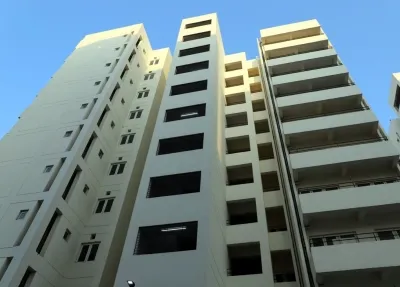
The Reserve Bank of India reports a 2.2% growth in the all-India House Price Index for Q2 of 2025-26. Despite the increase, the growth rate has slowed compared to last year. Key cities like Nagpur, Ghaziabad, and Chandigarh contributed to this rise, while other regions showed a decline.
Key Takeaways
The all-India HPI rose by 2.2% in Q2:2025-26.
Growth is less than the 7% increase from the previous year.
Key contributors include Nagpur , Ghaziabad , and Chandigarh .
Quarter-on-quarter, the index declined by 0.6% .
New base year for HPI is 2022-23 .
Mumbai, Nov 27 (NationPress) The all-India House Price Index (HPI), which tracks real estate transactions across 18 major cities in India, has seen a 2.2% rise in the second quarter of the financial year 2025-26 compared to the same quarter last year, according to the latest data published by the Reserve Bank of India (RBI) on Thursday.
Cities such as Nagpur, Ghaziabad, and Chandigarh played a significant role in this HPI increase, as noted in the RBI’s announcement.
However, this growth is notably less than the 7% growth recorded during the same period last year.
When comparing quarter-on-quarter, the index has decreased by 0.6%, primarily due to declines in cities like Kolkata, Chennai, Lucknow, and Hyderabad.
The House Price Index fell from 113.4 in Q1:2025-26 to 112.7 in Q2:2025-26, reflecting a downward trend, as explained by the RBI.
The HPI is compiled quarterly by the Reserve Bank based on transaction-level data sourced from registration authorities.
The 18 cities included in the RBI's assessment are Mumbai, Delhi, Chennai, Kolkata, Bangalore, Lucknow, Ahmedabad, Jaipur, Kanpur, Kochi, Hyderabad, Thiruvananthapuram, Pune, Ghaziabad, Thane, Gautam Buddha Nagar, Chandigarh, and Nagpur.
The HPI for Q2:2025-26 has been calculated using a new base year of 2022-23, replacing the previous base year of 2010-11.
Additionally, eight new cities, including Hyderabad, Thiruvananthapuram, Pune, Ghaziabad, Thane, Gautam Buddha Nagar, Chandigarh, and Nagpur, have been incorporated into the index to enhance its coverage.
In the first quarter of the current fiscal year, the all-India HPI rose by 3.6% year-on-year, according to RBI data released last month, which was lower than the 7.6% growth seen in the previous year. Cities like Nagpur, Chandigarh, Chennai, and Kochi showed the highest increase compared to last quarter.
Point of View
I believe this rise in the all-India House Price Index reflects a cautious optimism in the housing market. While significant growth has been observed in select cities, the overall slowdown compared to previous years warrants attention from policymakers and potential homebuyers alike. It is crucial to monitor these trends closely as they impact economic stability and growth.
NationPress
20 Jun 2026
Frequently Asked Questions
What is the all-India House Price Index?
The all-India House Price Index (HPI) measures the price changes in residential properties based on real estate transactions across major cities in India.
Why did the HPI increase by 2.2%?
The HPI increased due to positive contributions from cities like Nagpur, Ghaziabad, and Chandigarh, despite a slowdown compared to last year's growth.
Which cities are included in the HPI calculation?
The HPI is calculated based on data from 18 major cities, including Mumbai, Delhi, Chennai, and Kolkata, among others.
How is the HPI compiled?
The HPI is compiled quarterly by the Reserve Bank of India using transaction-level data collected from registration authorities.
What does the decline in the index indicate?
The quarter-on-quarter decline of 0.6% indicates a drop in residential property prices in certain cities, which may reflect market adjustments.