India's core infrastructure index up 0.5% in May; cement, steel, electricity lead
Synopsis
India's eight core industries grew just 0.5% in May 2026 — but the headline masks a sharp split: cement surged 8.4% and electricity 8.7% on the back of government infrastructure spending, while coal, crude oil, and refinery products each fell sharply. The April reading was also revised up to 1.8%, making the May dip a potential speed bump rather than a trend reversal.
Key Takeaways
India's Index of Eight Core Industries grew 0.5 per cent in May 2026 year-on-year, according to the Commerce and Industry Ministry .
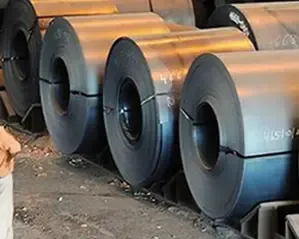
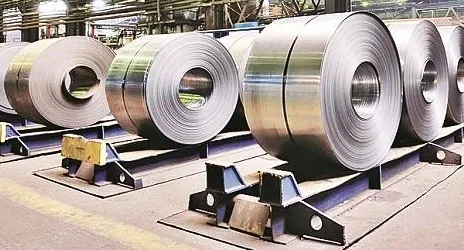
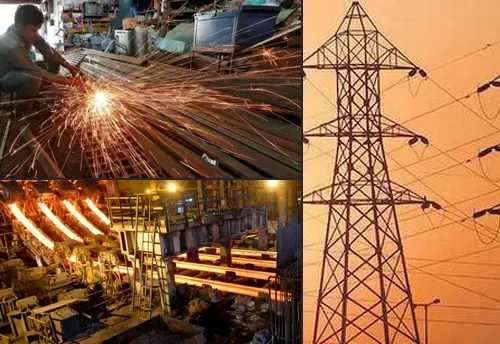
Cement led all sectors with 8.4 per cent growth; electricity generation rose 8.7 per cent ; steel expanded 5 per cent .
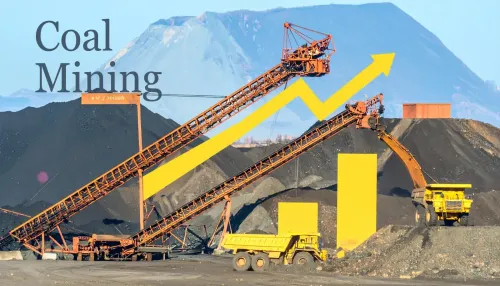
Coal production fell 9.3 per cent , refinery products dropped 8.7 per cent , and crude oil declined 4.6 per cent .
Fertiliser output dipped 0.9 per cent , reportedly linked to raw material shortages from the West Asia conflict .
The April 2026 growth rate was revised upward to 1.8 per cent ; cumulative April–May 2026-27 growth stands at 1.1 per cent .
The eight core industries represent 40.27 per cent of the weight in the Index of Industrial Production (IIP) .
India's Index of Eight Core Industries (ICI) rose 0.5 per cent in May 2026 compared to the same month a year earlier, according to data released by the Commerce and Industry Ministry on Monday, 22 June. Cement, steel, and electricity were the primary drivers of the modest uptick, even as fossil fuel sectors weighed on the headline number.
Sectors That Drove Growth
Cement posted the strongest performance among the eight tracked industries, clocking 8.4 per cent growth in May — a reflection of sustained demand from large-scale government spending on highways, ports, and railways. Steel production expanded by 5 per cent over the same month last year, supported by the same infrastructure pipeline. Electricity generation rose 8.7 per cent, signalling healthy industrial and household demand heading into the summer peak.
Sectors That Dragged
Coal production contracted sharply by 9.3 per cent in May, while crude oil output fell 4.6 per cent and natural gas declined 4.9 per cent. Refinery products output dropped 8.7 per cent during the month. Fertiliser production dipped 0.9 per cent, reportedly due to a decline in raw material availability linked to the ongoing West Asia conflict.
April Revised Upward; Cumulative Picture
The final growth rate for April 2026 was revised upward to 1.8 per cent, an improvement over the earlier provisional estimate. The cumulative growth rate for the April–May 2026-27 period now stands at 1.1 per cent compared to the corresponding period of the previous year — a modest but positive trajectory.
Why the ICI Matters
The eight core industries — coal, crude oil, natural gas, refinery products, fertilisers, steel, cement, and electricity — collectively account for 40.27 per cent of the weight of items in the Index of Industrial Production (IIP). As a result, the ICI is widely used as an early indicator of broader industrial activity in the economy. A sub-1 per cent headline reading in May suggests that energy sector weakness is offsetting the construction-linked momentum visible in cement and steel.
What to Watch
The divergence between construction-linked sectors and fossil fuel output is likely to persist as long as government infrastructure spending remains elevated while domestic hydrocarbon production faces structural headwinds. Analysts will watch whether the IIP reading for May mirrors the core sector's mixed picture when it is released later this month.
Point of View
But the composition tells a more nuanced story. Cement at 8.4 per cent and electricity at 8.7 per cent are not soft numbers — they reflect genuine construction demand driven by the Centre's capital expenditure push. The problem is that fossil fuel sectors are in retreat: coal down 9.3 per cent and refinery products down 8.7 per cent are drags that no amount of highway spending can easily offset. The revised April figure of 1.8 per cent also raises a question that rarely gets asked — how often do provisional ICI readings get revised, and by how much? If the May number is similarly revised upward, the narrative changes. For now, the data points to a two-speed industrial economy: construction is running, energy production is not keeping pace.
NationPress
22 Jun 2026
Frequently Asked Questions
What is the Index of Eight Core Industries (ICI)?
The ICI tracks the combined and individual output of eight key sectors — coal, crude oil, natural gas, refinery products, fertilisers, steel, cement, and electricity. These eight industries account for 40.27 per cent of the weight in India's Index of Industrial Production (IIP), making the ICI a reliable early indicator of overall industrial growth.
Which sectors grew in May 2026?
Cement recorded the highest growth at 8.4 per cent, followed by electricity generation at 8.7 per cent and steel at 5 per cent. Demand for cement and steel was supported by government investments in highways, ports, and railways.
Which sectors declined in May 2026?
Coal production fell 9.3 per cent, refinery products dropped 8.7 per cent, crude oil output declined 4.6 per cent, and natural gas fell 4.9 per cent. Fertiliser production also dipped 0.9 per cent, reportedly due to raw material shortages linked to the West Asia conflict.
Was the April 2026 core sector data revised?
Yes. The final growth rate for April 2026 was revised upward to 1.8 per cent. The cumulative growth for the April–May 2026-27 period now stands at 1.1 per cent compared to the same period last year.
Why does the core sector data matter for the broader economy?
The eight core industries carry a combined weight of 40.27 per cent in the IIP, which is the primary measure of India's industrial output. A sustained slowdown or acceleration in the ICI typically foreshadows a similar trend in the broader IIP reading released later in the month.