Are Credit Costs for Banks Increasing in Q1FY26, While GNPA Shows Slight Improvement?

Synopsis
In Q1FY26, India's Scheduled Commercial Banks experienced a 9.5% growth in loans, trailing behind a 10.1% deposit increase. Despite rising credit costs, asset quality showed slight improvement with a marginal drop in GNPA ratios, suggesting cautious optimism in the banking sector.
Key Takeaways
Loan growth for SCBs in Q1FY26 was 9.5% YoY.
Deposit growth was 10.1% .
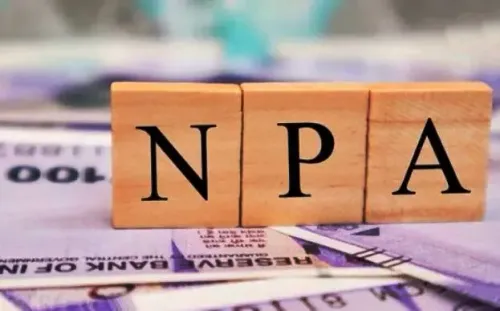
The GNPA ratio improved to 2.3% .
NNPAs decreased by 8.7% YoY.
Credit costs for SCBs rose to 0.61% .
New Delhi, Aug 20 (NationPress) The volume of loans issued by Scheduled Commercial Banks (SCBs) in India witnessed a 9.5% year-on-year growth in Q1FY26, trailing slightly behind the 10.1% growth in deposits. Future growth is anticipated to remain moderate, as stated in a report released on Wednesday.
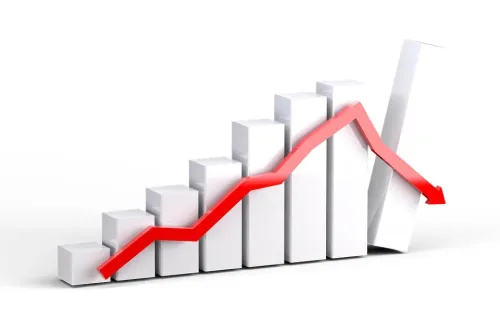
The credit costs for SCBs have risen by 19 basis points year-on-year, although there was a slight enhancement in asset quality for the quarter. The Gross Non-Performing Asset (GNPA) ratio dropped from 2.7% to 2.3% compared to the previous year, according to CareEdge Ratings.
GNPA levels improved by 9.5% YoY to Rs 4.18 lakh crore as of Q1FY26, facilitated by consistent recoveries, upgradations, and write-offs, particularly in Public Sector Banks (PSBs).
The Net Non-Performing Asset (NNPA) ratio remained stable despite a 0.5% sequential increase in GNPAs each quarter, largely due to rising slippages in the microfinance and unsecured lending sectors at specific banks.
The report noted, "The NNPA ratio of SCBs was 0.5% in Q1FY26 for the second successive quarter, down from 0.6% a year ago. NNPAs decreased by 8.7% YoY to Rs 0.92 lakh crore as of Q1FY26."
The annualized credit cost for SCBs increased by 19 basis points to 0.61% in Q1FY26. In contrast, PSBs experienced a decline of 6 basis points to 0.35%, while Private Sector Banks (PVBs) saw an increase to 1.02%.
NNPAs for PSBs slightly decreased by 6 basis points sequentially, whereas PVBs faced a rise of 51 basis points.
The rise in credit costs among PVBs was primarily attributed to heightened provisions at a major private bank due to technical accounting adjustments, along with increased slippages reported by several other PVBs this quarter.
aar/vd
Point of View
We at Nation closely monitor the banking sector dynamics. The recent trends in credit costs and GNPA ratios reflect a cautious but hopeful outlook. While challenges remain, the slight improvements in asset quality indicate resilience within the banking industry. Our commitment is to provide accurate and timely insights that empower our readers.
NationPress
7 Jul 2026
Frequently Asked Questions
What is the GNPA ratio for SCBs in Q1FY26?
The Gross Non-Performing Asset (GNPA) ratio for Scheduled Commercial Banks (SCBs) in Q1FY26 is 2.3% , a decrease from 2.7% a year earlier.
How much have loan disbursements grown year-on-year?
Loan disbursements by SCBs grew by 9.5% year-on-year in Q1FY26.
What is the current NNPA ratio for SCBs?
The Net Non-Performing Asset (NNPA) ratio for SCBs remained steady at 0.5% in Q1FY26.
What factors contributed to the increase in credit costs?
The rise in credit costs for Private Sector Banks (PVBs) was primarily driven by higher provisions at a major bank and increased slippages.
How much did the credit costs increase in Q1FY26?
The annualized credit costs for SCBs increased by 19 basis points to 0.61% in Q1FY26.