India's core industrial output up 4.8% in August; cement, electricity lead gains
Synopsis
India's core industrial output grew 4.8% in August 2026, with cement surging 12.5% and electricity up 11.6%. But coal, crude oil, and fertilisers contracted — a split that reveals the uneven terrain beneath a broadly improving headline. The cumulative April–August pace of 4.3% nearly doubles last year's 2.4%, putting India's industrial momentum on firmer ground heading into the festive quarter.
Key Takeaways
India's Index of Core Industries (ICI) grew 4.8 per cent year-on-year in August 2026 (provisional).
Cement led all sectors at 12.5 per cent growth; electricity followed at 11.6 per cent .
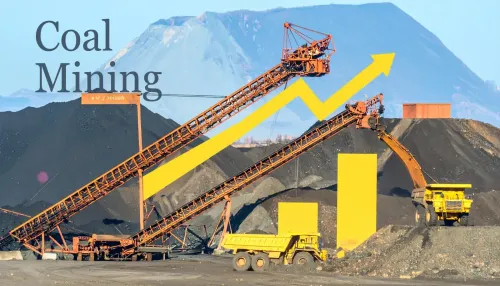
Coal , crude oil , natural gas , and fertilisers recorded negative growth in August.
Cumulative ICI growth for April–August 2026 stood at 4.3 per cent , up sharply from 2.4 per cent in the same period last year.
July's final ICI growth was revised down to 5.0 per cent from a provisional 5.4 per cent .
HSBC India Manufacturing PMI held at 52.8 in August, signalling expansion despite softer demand conditions.
India's Index of Core Industries (ICI) grew by 4.8 per cent (provisional) in August 2026 on a year-on-year basis, driven by strong performance in cement, electricity, and iron ore, according to data released by the Commerce Ministry. The reading marks a slight moderation from the 5.0 per cent growth recorded in July (final index), but continues a broad upward trend in core sector momentum.
Sector-wise Performance
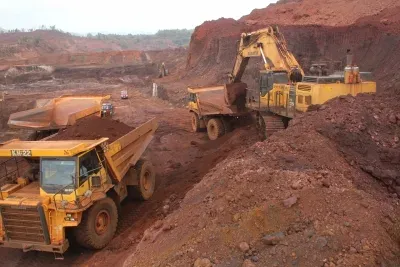
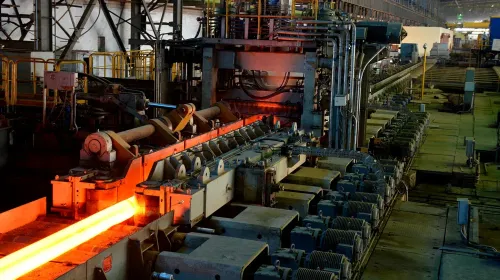
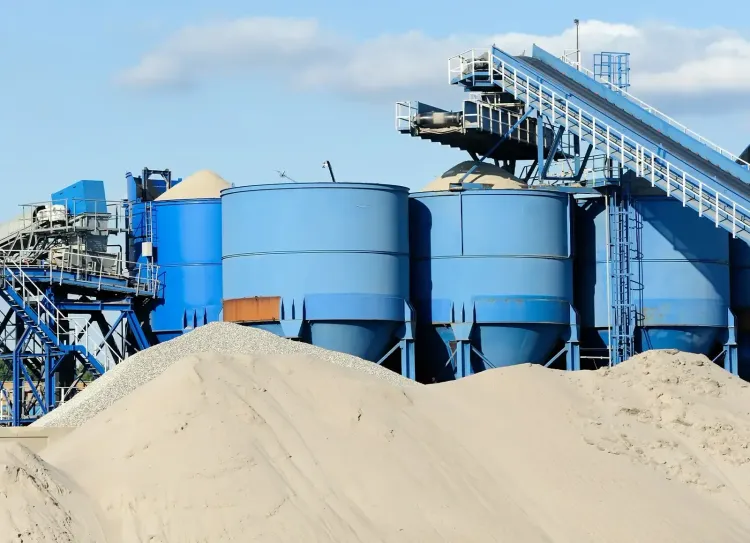
Cement posted the highest growth among all eight core industries at 12.5 per cent, followed by electricity at 11.6 per cent. Iron ore, steel, and refinery products recorded growth of 5.5 per cent, 3.4 per cent, and 2.6 per cent, respectively, during the month.
Notably, iron ore, electricity, and cement have been consistent drivers of overall industrial production growth over recent months, reflecting sustained construction activity and infrastructure push.
Sectors in Contraction
On the other hand, coal, natural gas, crude oil, and fertilisers recorded negative growth in August 2026, signalling uneven momentum across the core industrial basket. The underperformance of energy-linked inputs such as crude oil and natural gas could weigh on downstream sectors if the trend persists.
April–August Cumulative Growth
The cumulative growth rate of the ICI for the April–August 2026 period stood at 4.3 per cent (provisional estimate), a significant improvement over the 2.4 per cent recorded in the corresponding period of the previous year. This acceleration reflects strengthening in infrastructure-linked output and positions India's industrial base on a firmer footing ahead of the second half of the fiscal year.
Separately, the final index for July 2026 was revised downward from 121.2 (provisional) to 120.8, with the annual growth rate revised from 5.4 per cent to 5.0 per cent.
New ICI Base Year Series
This release also reflects a methodological shift: the Office of Economic Adviser under the Department for Promotion of Industry and Internal Trade (DPIIT) introduced a revised ICI series with Base Year 2022-23 in July, replacing the earlier 2011-12 base year series. The updated benchmark is intended to better capture structural changes in India's industrial economy.
Manufacturing PMI Signals Steady Expansion
In a parallel data point, India's manufacturing sector continued to expand in August, with the HSBC India Manufacturing PMI holding at 52.8. While the reading signals growth — any figure above 50 indicates expansion — firms reported softer demand conditions that led to weaker increases in buying levels and inventory stocks.
Despite subdued demand, business confidence firmed up. Around 16 per cent of survey participants forecast higher output over the next 12 months, while the remainder expected no change. Confidence rose to its highest level since May, though it remained below historical averages, according to the PMI data. With the ICI's cumulative trajectory trending upward and manufacturing PMI staying in expansionary territory, all eyes will be on energy-sector recovery and demand conditions heading into the festive quarter.
Point of View
But the composition is worth scrutiny. Cement and electricity — both infrastructure proxies — are doing the heavy lifting, while crude oil, natural gas, and coal are all in the red. That energy drag is a structural concern: if input-energy sectors underperform alongside softer PMI demand readings, the headline growth number could struggle to sustain itself through H2. The base-year revision to 2022-23 also means year-on-year comparisons are now recalibrated — the acceleration from last year's 2.4% cumulative to this year's 4.3% must be read with that methodological shift in mind.
NationPress
21 Sept 2026
Frequently Asked Questions
What is the Index of Core Industries (ICI) and why does it matter?
The Index of Core Industries (ICI) tracks output across eight key sectors — coal, crude oil, natural gas, refinery products, fertilisers, steel, cement, and electricity — that together account for a significant share of India's overall industrial production. A rise in the ICI typically signals broader economic momentum, making it a closely watched leading indicator.
Which sectors drove India's core industrial growth in August 2026?
Cement (12.5%), electricity (11.6%), iron ore (5.5%), steel (3.4%), and refinery products (2.6%) all recorded positive growth in August 2026. Cement and electricity have been consistent growth drivers over recent months, reflecting strong infrastructure and construction activity.
Which core sectors contracted in August 2026?
Coal, natural gas, crude oil, and fertilisers all posted negative growth in August 2026. The contraction in energy-linked sectors is a concern, as it could affect input costs and downstream industrial activity if the trend continues.
How does August's ICI growth compare to earlier periods?
August's provisional growth of 4.8% is slightly lower than July's final reading of 5.0%. However, the cumulative April–August 2026 growth of 4.3% is nearly double the 2.4% recorded in the same period of the previous year, indicating an improving trend over the fiscal year so far.
What does the HSBC India Manufacturing PMI reading of 52.8 indicate?
A PMI reading above 50 signals expansion in manufacturing activity. August's reading of 52.8 confirms continued growth, though firms reported softer demand conditions and weaker inventory build-up. Business confidence rose to its highest level since May, but remained below historical averages.