India's infra push: ₹19.26 lakh crore spent across 1,775 projects, MoSPI data shows
Synopsis
MoSPI's July 2026 flash report reveals India has crossed the halfway mark on cumulative infrastructure spending — ₹19.26 lakh crore out of a ₹37.11 lakh crore revised outlay — across 1,775 projects in 17 ministries. With 675 projects over 80% physically complete, the data points to a build-out that is genuinely in motion, not just on paper.
Key Takeaways
MoSPI is monitoring 1,775 large infrastructure projects across 17 Central Ministries as of July 2026 .
Total revised project cost stands at ₹37.11 lakh crore ; cumulative expenditure has reached ₹19.26 lakh crore ( 51.91% ).
675 projects ( 38% ) have crossed 80% physical completion ; 305 projects ( 17% ) have crossed 80% financial completion .
Transport and logistics dominates with ₹19.81 lakh crore across 1,246 projects — 70% of all monitored projects.
Energy sector accounts for ₹10.66 lakh crore across 205 projects , the second-largest share at 29% .
Physical and financial progress broadly move in tandem, indicating a well-paced dual pipeline of new and near-complete projects.
India has channelled ₹19.26 lakh crore — roughly 51.91 per cent of the total revised outlay — into 1,775 large-scale infrastructure projects being tracked by the Ministry of Statistics and Programme Implementation (MoSPI) across 17 Central Ministries, according to the ministry's flash report for July 2026 released on Tuesday, 25 August. The total revised project cost stands at ₹37.11 lakh crore, signalling one of the most expansive infrastructure build-outs in India's post-Independence history.
Progress at a Glance
Of the 1,775 projects under active monitoring, 675 projects — or 38 per cent of the total — have crossed the 80 per cent physical completion threshold, placing them at advanced stages of implementation. A further 305 projects, representing 17 per cent, have achieved over 80 per cent financial completion. MoSPI notes that physical and financial progress broadly move in tandem, with a large cluster of projects at both the initial (0–20 per cent) and advanced (81–100 per cent) stages — reflecting a dual pipeline of newly launched schemes and those nearing delivery.
Transport and Logistics Leads the Pack
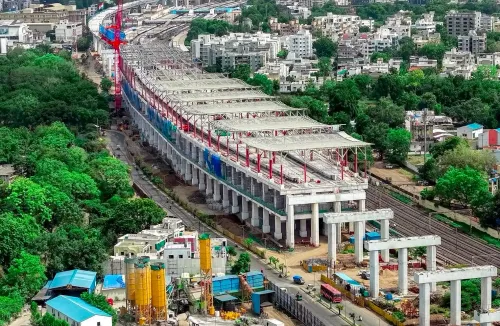
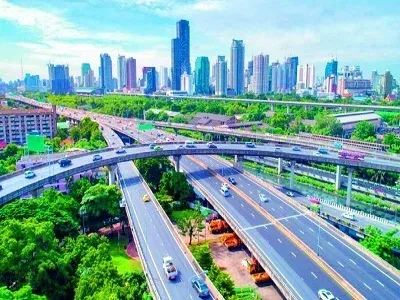
Transport and logistics is the dominant sector, accounting for 53 per cent of the total revised project cost at ₹19.81 lakh crore across 1,246 projects — 70 per cent of all monitored projects. This encompasses roads and highways, railways, aviation, urban public transport, shipping, and inland waterways. The concentration underscores the Centre's strategic emphasis on physical connectivity as the backbone of economic integration and logistics efficiency.
Energy, Communications, and Social Sectors
The energy sector ranks second, with a revised cost of ₹10.66 lakh crore (29 per cent) spread across 205 projects, covering oil and gas infrastructure, electricity generation, transmission and distribution networks, and energy storage systems. Water and sanitation projects account for ₹2.05 lakh crore (5 per cent) across 53 projects, while communications infrastructure — targeting digital connectivity — covers 31 projects worth ₹1.34 lakh crore (4 per cent). Social and commercial infrastructure, comprising 91 projects with a revised cost of ₹0.99 lakh crore (3 per cent), reflects selective investments in education, healthcare, real estate, and tourism. Projects classified under 'Others' — including coal, steel, metals, and mining — span 149 projects worth ₹2.26 lakh crore (6 per cent).
What the Data Signals
The balanced distribution across early and advanced implementation stages suggests a healthy project pipeline rather than a bunching of stalled or delayed works — a pattern that has historically plagued large public infrastructure programmes in India. Notably, this is the first MoSPI flash report to record cumulative expenditure crossing the 50 per cent mark of total revised cost across all monitored projects simultaneously. As more projects approach the 81–100 per cent completion band, the pace of final disbursements and commissioning will be closely watched by infrastructure investors and state governments alike.
Point of View
Not spend rate. India has a long record of projects that absorb funds without delivering commissioned assets on time. The MoSPI flash report tracks financial and physical progress, but does not publish time-overrun or cost-overrun data prominently — two indicators that historically tell a very different story. With 675 projects reportedly past 80% physical completion, the next test is whether commissioning follows swiftly, or whether the final 20% — often the most complex and politically contested — drags on for years. The transport and logistics concentration at 53% of revised cost is strategically sound, but the relatively modest 3% share for social and commercial infrastructure raises a question about whether the build-out is tilted toward freight and mobility at the expense of health and education assets.
NationPress
10 Oct 2026
Frequently Asked Questions
What is MoSPI's July 2026 infrastructure flash report?
It is a monthly progress update published by the Ministry of Statistics and Programme Implementation tracking large central-sector infrastructure projects. The July 2026 report covers 1,775 projects across 17 Central Ministries with a total revised cost of ₹37.11 lakh crore.
How much has India spent on these infrastructure projects so far?
Cumulative expenditure on the 1,775 monitored projects stands at ₹19.26 lakh crore, which is approximately 51.91 per cent of the total revised project cost of ₹37.11 lakh crore, according to MoSPI's July 2026 flash report.
Which sector accounts for the largest share of infrastructure spending?
Transport and logistics leads with a revised cost of ₹19.81 lakh crore — 53 per cent of the total — spread across 1,246 projects. This covers roads and highways, railways, aviation, urban public transport, shipping, and inland waterways.
How many projects are near completion?
As of July 2026, 675 projects — 38 per cent of the total — have crossed 80 per cent physical completion, while 305 projects (17 per cent) have crossed 80 per cent financial completion, according to MoSPI data.
What other sectors feature in MoSPI's infrastructure monitoring?
Beyond transport, the energy sector accounts for ₹10.66 lakh crore across 205 projects; water and sanitation for ₹2.05 lakh crore across 53 projects; communications for ₹1.34 lakh crore across 31 projects; and social and commercial infrastructure for ₹0.99 lakh crore across 91 projects.