India IIP grows 8% in August 2026, manufacturing sector posts 9% rise
Synopsis
India's factory output logged its third consecutive month of 8%-plus growth in August 2026, with manufacturing surging 9% and capital goods jumping 16.9% — a signal that private investment is broadening. A simultaneous methodology shift, replacing WPI with PPI as the IIP deflator, adds fresh precision to a dataset watched closely by policymakers and markets.
Key Takeaways
India's IIP grew 8% year-on-year in August 2026 , driven by the manufacturing sector , which rose 9% .
Manufacturing has now posted 8% or higher growth for three consecutive months — a record run, according to official data.
18 out of 23 manufacturing industry groups recorded positive growth; top performers were electrical equipment (+30.9%) , machinery and equipment (+25.3%) , and motor vehicles (+25.2%) .
Capital goods production surged 16.9% , signalling broad-based real investment in the economy.
The mining sector contracted 5.6% , the only major drag in the August data.
MoSPI has revised the IIP 2022–23 series , replacing WPI with output PPI as the deflator for 234 item groups , covering 36.02% of the index weight.
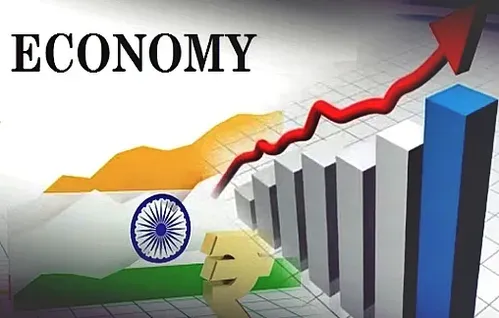
India's Index of Industrial Production (IIP) surged 8 per cent in August 2026 on a year-on-year basis, with the manufacturing sector — which accounts for more than three-fourths of the index — leading the charge with a 9 per cent expansion, according to data released by the Ministry of Statistics and Programme Implementation (MoSPI) on Monday, 28 September 2026. The reading marks a sustained acceleration, with manufacturing clocking growth of 8 per cent or more for three consecutive months — a record run, according to the official statement.
Manufacturing Leads Across Sub-Sectors
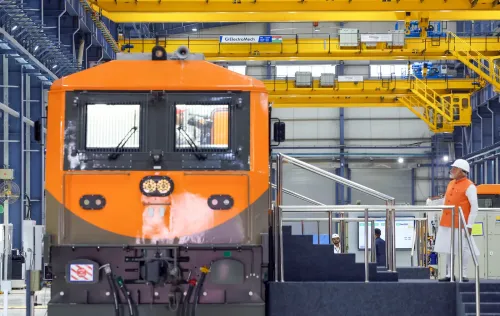
18 out of 23 industry groups within manufacturing recorded positive growth in August compared to the same month last year. The top three contributors were electrical equipment manufacturing, which surged 30.9 per cent; machinery and equipment, which rose 25.3 per cent; and motor vehicles, which expanded 25.2 per cent. These segments collectively signal broad-based industrial demand rather than a narrow sectoral spike.
The electricity and gas supply sector posted a strong 12.3 per cent growth during the month, while water supply, sewerage and waste management grew 6.3 per cent. The lone drag came from the mining sector, which contracted 5.6 per cent — a notable reversal amid otherwise robust headline numbers.
Capital Goods and Consumer Demand Signal Investment Momentum
On a use-based classification, capital goods production — comprising factory machinery and industrial equipment — jumped 16.9 per cent in August, reflecting the level of real investment flowing into the economy. Economists typically treat this segment as a leading indicator, given its multiplier effect on future jobs and income generation.
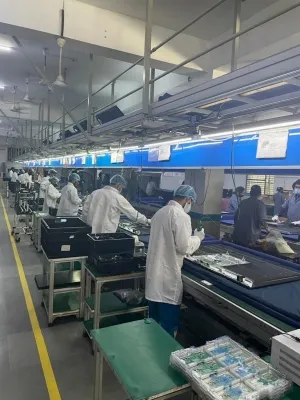
Consumer durables such as electronic goods, refrigerators, and televisions recorded a double-digit rise of 11.1 per cent, pointing to strengthening household demand amid rising incomes. Consumer non-durables — including soaps and cosmetics — grew at a more modest 2.1 per cent. The infrastructure and construction goods segment expanded 6.4 per cent, underpinned by the government's continued capital expenditure push on highways, ports, and railway projects.
Methodology Revision: PPI Replaces WPI as Deflator
MoSPI has introduced a significant methodological change, replacing the Wholesale Price Index (WPI) with the output Producer Price Index (PPI) as the deflator for item groups where output is measured in value terms. This revision affects 234 out of 463 item groups in the IIP basket, representing 36.02 per cent of the total index weight. The ministry has revised and released the entire IIP 2022–23 series using the new PPI-based deflator, superseding the earlier WPI-based series released on 1 June 2026.
The shift is intended to improve the accuracy and international comparability of India's industrial output data. Analysts note that PPI better captures producer-level price changes, making it a more appropriate deflator than the broader WPI basket for this purpose.
What the Numbers Mean for India's Economy
The three-month manufacturing streak comes at a critical juncture. India's official GDP growth targets for FY27 are underpinned by assumptions of sustained industrial expansion, and consecutive high-IIP prints strengthen the case for that trajectory. Notably, the capital goods surge suggests private sector investment — not just government spending — is beginning to pick up. This is an important transition, as government-led capex has driven much of India's infrastructure momentum over the past two years.
The mining sector's contraction warrants watching; if it persists, it could weigh on headline IIP in coming months. The next IIP print, covering September 2026, will be closely tracked to see whether the manufacturing momentum holds through the festive season.
Point of View
And a meaningful one for an economy trying to grow its industrial base without leaning entirely on government capex. The capital goods surge at 16.9% is the most encouraging data point: it suggests private balance sheets are opening up for investment, which is the transmission channel that policy has been waiting for. The mining contraction is an outlier worth monitoring, but the bigger story is whether this IIP momentum survives the global demand uncertainty building in the US and Europe. The PPI deflator shift, though technical, also matters: it will likely recalibrate historical comparisons and could quietly revise earlier growth narratives once the full series is absorbed by analysts.
NationPress
29 Sept 2026
Frequently Asked Questions
What is India's IIP growth rate for August 2026?
India's Index of Industrial Production (IIP) grew 8% year-on-year in August 2026, according to data released by MoSPI on 28 September 2026. The manufacturing sector, which makes up over three-fourths of the IIP, posted an even stronger 9% growth during the same period.
Which sectors drove India's industrial growth in August 2026?
Manufacturing led the growth with a 9% rise, followed by electricity and gas supply at 12.3%. Within manufacturing, electrical equipment (30.9%), machinery and equipment (25.3%), and motor vehicles (25.2%) were the top contributors. The mining sector was the sole drag, contracting 5.6%.
What does the capital goods surge mean for India's economy?
Capital goods production rose 16.9% in August 2026, reflecting real investment activity in the economy — factories buying machines and equipment signals that private sector capacity expansion is under way. Economists view this segment as a leading indicator, with a multiplier effect on future employment and income generation.
What methodological change has MoSPI made to the IIP?
MoSPI has replaced the Wholesale Price Index (WPI) with the output Producer Price Index (PPI) as the deflator for item groups where output is measured in value terms. This change affects 234 of 463 item groups in the IIP basket, representing 36.02% of the total index weight, and the revised IIP 2022–23 series supersedes the earlier WPI-based series released on 1 June 2026.
Is the manufacturing sector's growth streak significant?
Yes — the official statement described it as a record performance, with manufacturing registering growth of 8% or more for three consecutive months through August 2026. This streak is significant because it suggests sustained industrial momentum rather than a one-off spike, which has positive implications for employment and overall GDP growth.