India Housing Price Index up 3.6% in Q1FY27 as tier-2 cities lead gains
Synopsis
India's housing market is holding steady on paper — but the story beneath the national average is a tale of two markets. Tier-2 cities like Chandigarh and Jaipur are surging while metros like Kolkata and Delhi contract, pointing to a structural geographic rebalancing of residential demand that the headline HPI figure alone does not capture.
Key Takeaways
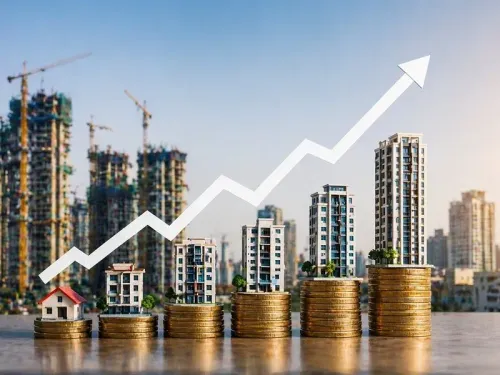
India's Housing Price Index (HPI) rose 3.6 per cent YoY in Q1FY27 , matching the pace of Q1FY26 , per a Bank of Baroda report.
Quarter-on-quarter HPI growth accelerated to 1.1 per cent in Q1FY27 , up from 0.5 per cent in Q4FY26 .
Housing credit expanded 11 per cent in Q1FY27 , remaining stable despite broader economic pressures.
Chandigarh led annual gains at 49.6 per cent , driven by a collector rate revision effective 1 April 2026 and limited new land supply.
Kolkata recorded the steepest decline at -31.5 per cent ; Delhi fell 1.2 per cent and Hyderabad slipped 0.8 per cent .
Tier-2 cities are increasingly driving residential demand, supported by better connectivity and growing service-sector employment.
India's Housing Price Index (HPI), tracked by the Reserve Bank of India (RBI) across 18 cities, rose 3.6 per cent year-on-year in Q1FY27, according to a report released by Bank of Baroda on 16 September. The reading mirrors the pace recorded in Q1FY26, signalling a degree of stability in India's residential property market even as broader inflation climbed during the quarter.
Key Developments in Q1FY27
The annual HPI growth of 3.6 per cent in Q1FY27 moderated from 4.5 per cent recorded in Q4FY26. On a quarter-on-quarter basis, however, the index accelerated to 1.1 per cent, up from 0.5 per cent in the preceding quarter — suggesting short-term momentum is picking up. Separately, housing credit expanded 11 per cent in the same period, holding steady despite wider economic headwinds, according to the Bank of Baroda report.
What Is Driving Housing Inflation
Higher input costs remain the primary pressure point. Global commodity prices and elevated construction costs have fed directly into housing prices, the report noted. This comes amid a broader inflationary surge in India during Q1FY27, partly attributed to the fallout from the West Asia conflict, which pushed commodity prices higher and disrupted global supply chains, weighing on growth across industries.
Cities Leading and Lagging
The sharpest annual price appreciation was recorded in Chandigarh at 49.6 per cent, a jump the report attributes to a revision in the collector rate effective 1 April 2026, compounded by a scarcity of new land parcels. Other top performers included Jaipur (36.4 per cent), Kanpur (27.5 per cent), Lucknow (17.7 per cent), and Thiruvananthapuram (16.3 per cent).
In contrast, several major metros either declined or posted muted growth. Kolkata saw the steepest contraction at -31.5 per cent, while Delhi fell 1.2 per cent and Hyderabad slipped 0.8 per cent. Mumbai managed a modest 2.8 per cent gain — well below the national average.
The Tier-2 Shift
Notably, the data reinforces a structural trend: tier-2 cities are increasingly driving residential market demand, outpacing traditional metros. Improved connectivity and the expansion of service-sector employment in smaller urban centres are cited as the underlying forces. This pattern has been building steadily over recent quarters and suggests that India's housing market is undergoing a geographic rebalancing, with demand dispersing away from saturated big-city markets.
What to Watch Next
With housing credit growth holding at 11 per cent and quarterly HPI momentum turning positive, the near-term outlook for residential real estate appears cautiously stable. However, any further escalation in global commodity prices — particularly if the West Asia situation worsens — could push construction costs higher and test affordability, especially in the tier-2 cities currently leading growth.
Point of View
But it masks a widening divergence: tier-2 cities are running hot while established metros cool or contract. Chandigarh's 49.6 per cent surge is partly a policy artefact — a collector rate revision — rather than organic demand, which raises questions about how much of the tier-2 rally is structural versus administratively induced. Meanwhile, Kolkata's 31.5 per cent contraction is a sharp outlier that warrants scrutiny beyond what aggregate data explains. With housing credit still growing at 11 per cent, the risk is that lending continues to chase a market whose geographic concentration of demand is shifting faster than lenders' risk models are adjusting.
NationPress
16 Sept 2026
Frequently Asked Questions
What is India's Housing Price Index and what does the Q1FY27 data show?
The Housing Price Index (HPI) is a Reserve Bank of India measure tracking residential property price movements across 18 cities. In Q1FY27, it rose 3.6 per cent year-on-year — matching the pace of Q1FY26 — and grew 1.1 per cent on a quarter-on-quarter basis, according to a Bank of Baroda report released on 16 September.
Why did housing prices rise in India despite higher inflation?
Higher input costs — including elevated global commodity prices and construction costs — contributed to the rise in housing prices. The West Asia conflict reportedly disrupted supply chains and pushed commodity prices higher, feeding into broader inflationary pressures across industries in Q1FY27.
Which cities saw the biggest rise and fall in housing prices in Q1FY27?
Chandigarh recorded the sharpest annual gain at 49.6 per cent, attributed to a collector rate revision from 1 April 2026 and limited new land availability. Kolkata saw the steepest decline at -31.5 per cent, followed by Delhi at -1.2 per cent and Hyderabad at -0.8 per cent.
Why are tier-2 cities outperforming metros in India's housing market?
Tier-2 cities are benefiting from improved connectivity infrastructure and the expansion of service-sector employment, which is drawing residential demand away from saturated metro markets. The Bank of Baroda report identifies this shift as a key structural driver of HPI growth in Q1FY27.
How is housing credit performing alongside the HPI data?
Housing credit grew 11 per cent in Q1FY27, holding steady despite broader economic challenges. This suggests that lending appetite for residential property remains resilient even as inflation and global headwinds weigh on the wider economy.