Delhi AQI: 14 stations record 'poor' air quality, Mundka worst at 273
Synopsis
Delhi's air quality is off to its worst October start in six years, with 14 monitoring stations already in the 'poor' zone and Mundka hitting AQI 273 — all before stubble burning, Diwali firecrackers, and winter inversions have fully set in. The numbers suggest this winter's pollution season could be particularly severe.
Key Takeaways
14 of 43 CPCB monitoring stations in Delhi recorded 'poor' AQI on 5 October 2026 .
Mundka reported the highest AQI at 273 ; CRRI Mathura Road and Narela followed at 257 each.
Delhi Cantonment recorded the cleanest air at AQI 97 ('satisfactory').
The city's average AQI for the first four days of October 2026 was 174.5 — the worst such start since 2020 (176.25).
Sunday's city-wide average AQI of 187 was the worst of the season so far.
Declining wind speeds, absence of rainfall, and localised PM10 emissions are the primary near-term drivers; stubble burning and Diwali firecrackers are yet to peak.
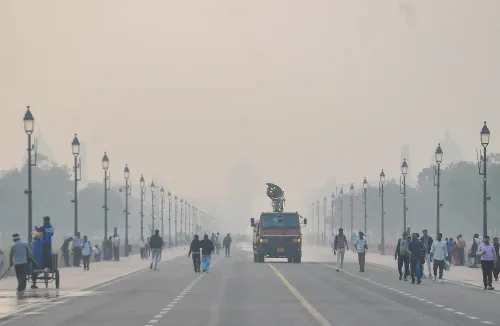
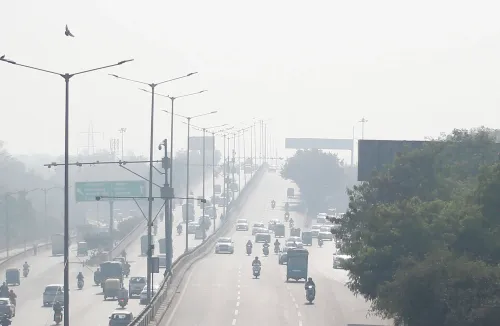
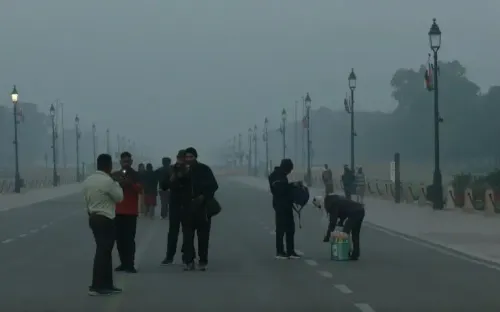
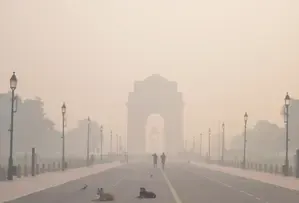
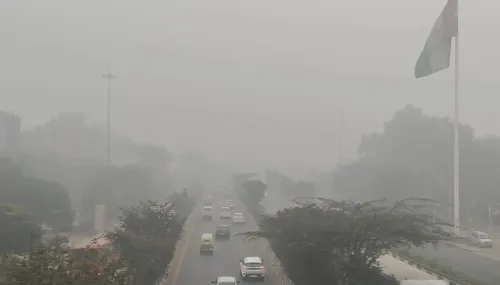
Delhi's air quality remained in the 'moderate' category on Monday, 5 October 2026, but data from the Central Pollution Control Board (CPCB) revealed that 14 of 43 operational monitoring stations across the national capital recorded pollution levels in the 'poor' category — underscoring a sharper-than-usual deterioration for this time of year.
Station-by-Station Breakdown
Among the worst-performing locations, Mundka topped the list with an AQI of 273, followed by CRRI Mathura Road and Narela, both at 257, and Jahangirpuri at 237. Other areas recording elevated levels included Alipur (238), Vivek Vihar (230), Punjabi Bagh (212), Wazirpur (221), Okhla Phase-2 (203), and R.K. Puram (193).
At the other end of the spectrum, Delhi Cantonment recorded the lowest AQI at 97, placing it in the 'satisfactory' category. JNU recorded 135 and Mandir Marg logged 146, both within the moderate band.
Worst October Start in Six Years
According to CPCB data, Delhi has witnessed one of its most polluted starts to October in the past six years. The average AQI during the first four days of October stood at 174.5 in 2026, significantly higher than 119.75 in 2025 and 167.25 in 2024. For context, the figure was 155 in 2023, 161.25 in 2022, 107.25 in 2021, and 176.25 in 2020.
On Sunday, the city's average AQI reached 187 — the worst reading of the season so far, placing it at the higher end of the moderate bracket. A brief respite from rainfall and strong winds earlier had helped disperse pollutants, but declining wind speeds and the return of localised emissions have reversed those gains.
Key Pollutants and Their Sources
PM10 — coarse, inhalable particles from road dust, construction activity, and biomass burning — has been among the primary drivers of the recent deterioration. The Commission for Air Quality Management (CAQM) has separately identified PM2.5 as a key seasonal pollutant, with secondary particulates from combustion-related emissions compounding the problem during winter months.
Under CPCB's classification scale, an AQI between 0 and 50 is 'good', 51–100 'satisfactory', 101–200 'moderate', 201–300 'poor', 301–400 'very poor', and 401–500 'severe'.
What Drives Winter Pollution in Delhi
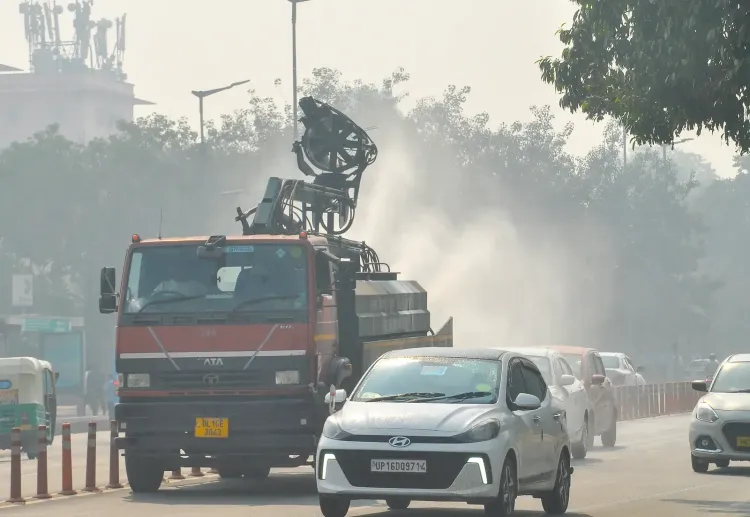
Air quality in Delhi-NCR typically begins declining from mid-September, with conditions worsening through November. Stubble burning in neighbouring states, vehicular emissions, industrial activity, power plants, and biomass burning are the primary year-round contributors. Firecrackers during the festive season — particularly around Diwali — can further spike pollution levels despite existing restrictions.
With the season's worst yet to arrive, authorities and residents alike face a testing few weeks ahead as meteorological conditions continue to suppress pollutant dispersal.
Point of View
But because of where it is heading — and how early the deterioration has begun. An average AQI of 174.5 in the first four days of October, with stubble burning, Diwali, and winter temperature inversions still ahead, is a structural warning, not a weather blip. The annual cycle of alarm followed by inadequate inter-state coordination on stubble burning and enforcement gaps on industrial emissions continues unbroken. Until source apportionment is matched by enforceable, time-bound action plans across Delhi-NCR and Punjab-Haryana, the CPCB data will keep telling the same story every October.
NationPress
5 Oct 2026
Frequently Asked Questions
What is Delhi's AQI today, 5 October 2026?
Delhi's overall AQI remained in the 'moderate' category on 5 October 2026, but 14 of 43 monitoring stations reported 'poor' levels. Mundka recorded the highest AQI at 273, while Delhi Cantonment logged the lowest at 97.
Which areas in Delhi have the worst air quality right now?
Mundka (AQI 273), CRRI Mathura Road (257), Narela (257), and Jahangirpuri (237) recorded the poorest air quality in Delhi as of the 4 pm bulletin on 5 October 2026. Alipur, Vivek Vihar, Wazirpur, and Okhla Phase-2 also crossed the 200-mark, placing them in the 'poor' category.
How does October 2026 compare to previous years for Delhi pollution?
Delhi's average AQI for the first four days of October 2026 was 174.5 — the second-worst start to the month in six years, behind only 2020's 176.25. It is significantly worse than October 2025 (119.75) and 2021 (107.25), according to CPCB data.
What is causing Delhi's air quality to deteriorate in October?
Declining wind speeds, the absence of recent rainfall, and localised PM10 emissions from road dust, construction, and biomass burning are the primary near-term drivers. Stubble burning from neighbouring states, vehicular and industrial emissions, and festive-season firecrackers typically worsen the situation further through November.
What do the CPCB AQI categories mean?
Under CPCB's scale: 0–50 is 'good', 51–100 'satisfactory', 101–200 'moderate', 201–300 'poor', 301–400 'very poor', and 401–500 'severe'. An AQI above 200 poses health risks, particularly for children, the elderly, and those with respiratory conditions.