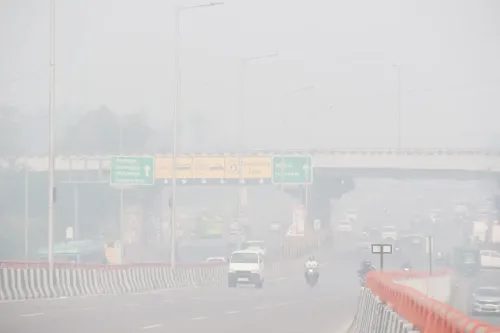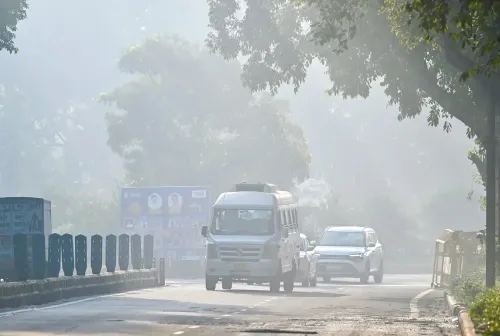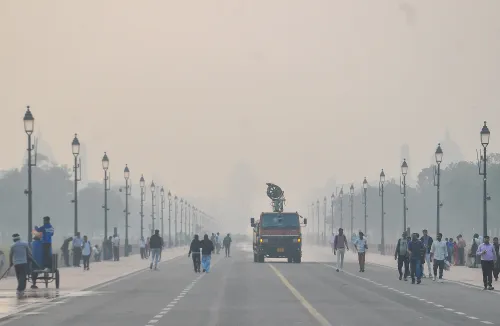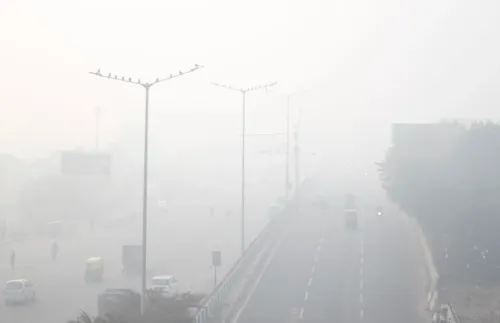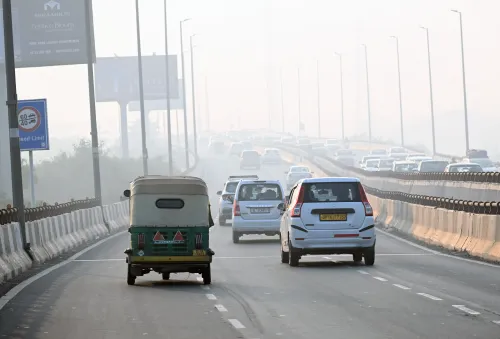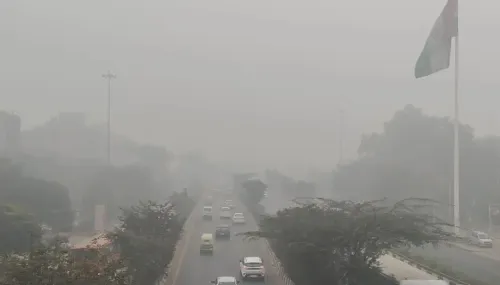


Delhi AQI at 214 on 18 November, stays in 'poor' category
Synopsis
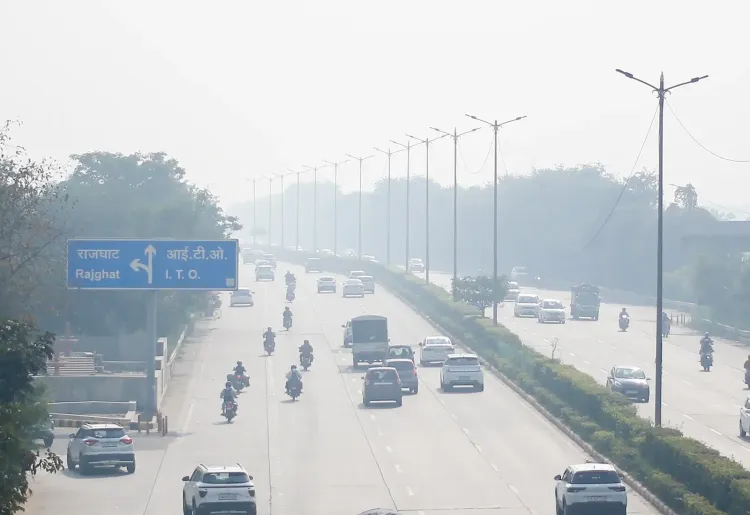
Delhi's AQI nudged up to 214 on 18 November — a slight setback after Tuesday's month-best 204 — but the city's air quality remains far better than the 'very poor' and 'severe' readings that defined early November. With Uttam Nagar at 399 and India Gate at a relatively clean 112, the capital's pollution map is sharply uneven, and one wind-speed dip away from a fresh deterioration.
Key Takeaways
Delhi's overall AQI stood at 214 on 18 November 2026 , remaining in the 'poor' category.
Reading rose marginally from Tuesday's 204 , which had been the month's cleanest air quality so far.
Of 58 monitoring stations , 36 reported 'poor' air quality and 21 reported 'moderate' levels.
Uttam Nagar was the worst locality at AQI 399 ('very poor'); Chandni Chowk followed at 292 .
India Gate recorded the best reading at AQI 112 ('moderate'); Indira Gandhi International Airport area stood at 197 .
Current levels are significantly better than early-November peaks, when multiple zones hit 'very poor' and 'severe' categories.
Delhi's overall Air Quality Index (AQI) stood at 214 on Wednesday, 18 November 2026, keeping the national capital firmly in the 'poor' category, according to data from the city's air quality monitoring network. The reading marked a marginal rise from Tuesday's AQI of 204, which had been the cleanest air recorded in Delhi so far this month.
Station-by-Station Breakdown
Of the 58 monitoring stations operating across the city, 36 reported air quality in the 'poor' range, while 21 recorded 'moderate' levels — indicating a wide variation in pollution intensity depending on location. The patchwork picture reflects Delhi's persistent micro-climate of localised emission sources, from traffic corridors to industrial clusters.
Uttam Nagar was the worst-performing locality, registering an AQI of 399 — just one unit short of the 'severe' threshold. Chandni Chowk followed at 292, and the area around the All India Institute of Medical Sciences (AIIMS) recorded 278. Punjabi Bagh and Jahangirpuri posted readings of 258 and 257 respectively, while the monitoring station at IIT Delhi registered 251. Anand Vihar, a chronic pollution hotspot, recorded an AQI of 206.
Relative Bright Spots
Not all parts of the capital fared poorly. The area around India Gate reported an AQI of 112, placing it in the 'moderate' category. The monitoring point near Jawaharlal Nehru Stadium stood at 152, and the zone around Indira Gandhi International Airport recorded 197 — also within the moderate band. These pockets of comparatively cleaner air are largely associated with open green spaces and lower vehicular density.
Context: A Partial Recovery from Early-November Peaks
The current readings, while still concerning, represent a notable improvement over the first half of November, when several Delhi localities had breached the 'very poor' and 'severe' thresholds. Seasonal factors — including drop in wind speed, stubble burning in neighbouring states, and temperature inversions that trap pollutants close to ground level — typically push Delhi's air quality to its worst between October and January. This year's trajectory has followed a broadly similar pattern, though mid-month conditions have offered temporary relief.
What to Watch
Air quality experts note that a single day's marginal deterioration does not signal a reversal of the improving trend, but conditions remain fragile. Any renewed spell of calm winds or a spike in farm-fire activity in Punjab and Haryana could push AQI levels back toward the 'very poor' range. Residents in high-pollution zones such as Uttam Nagar and Chandni Chowk are advised to limit outdoor exposure, particularly in the early morning hours when surface-level pollution concentrations tend to peak.
Point of View
In the grim arithmetic of Delhi winters, almost a good news story — but only by contrast. The month began with 'severe' readings, and the fact that Tuesday's 204 is being described as the cleanest day this month underscores how low the baseline is. The more telling data point is Uttam Nagar at 399: one unit below 'severe', and a reminder that the city's pollution burden is not spread evenly. South and central Delhi's greener, lower-traffic corridors consistently absorb a fraction of the pollution load that western and northern working-class localities do. Any serious air quality strategy must address that spatial inequality, not just the headline AQI.
NationPress
18 Nov 2026
Frequently Asked Questions
What is Delhi's AQI today, 18 November 2026?
Delhi's overall Air Quality Index was recorded at 214 on 18 November 2026, placing the city in the 'poor' category. This is a marginal rise from Tuesday's reading of 204, which had been the month's cleanest.
Which area in Delhi has the worst air quality today?
Uttam Nagar recorded the highest AQI of 399 on 18 November, placing it in the 'very poor' category — just one unit below the 'severe' threshold. Chandni Chowk and the AIIMS area also recorded elevated readings of 292 and 278 respectively.
Are any parts of Delhi reporting moderate or better air quality?
Yes. India Gate recorded an AQI of 112 and the Jawaharlal Nehru Stadium area stood at 152, both in the 'moderate' category. The Indira Gandhi International Airport zone also fell within moderate range at 197.
How does today's Delhi AQI compare to earlier in November?
Today's reading of 214 is significantly better than the 'very poor' and 'severe' levels recorded across several Delhi localities during the first half of November. Tuesday's 204 was the month's best reading so far before Wednesday's marginal rise.
Why does Delhi's air quality worsen in November?
November typically marks the onset of Delhi's worst pollution season due to a combination of falling wind speeds, temperature inversions that trap pollutants near ground level, cooler temperatures, and stubble burning in neighbouring states Punjab and Haryana. These factors together can push AQI readings rapidly from 'poor' into 'severe' ranges.